Part 1: Chart Overlay – Pinescript Tutorial Basics
Before we get started in you haven’t read my short introduction see this post here: About Me
Pinescript version 5
Useful links:
Goal
Add input functions to a simple chart overlay text indicator using Pinescript.
Let’s dive straight into this pinescript tutorial.
Load up your trading view account. https://www.tradingview.com/. Open up a chart and locate the “Pine Editor tab in the bottom right corner.
Opening the tab will display the editor.

Let’s rename the script to start in the editor – this is what shows up on your chart in the indicators list. In my case I will call it “Chart Overlay”. Let’s click the button “save” on the right top corner of the editor and name our script, I’ll name it the same “Chart Overlay”. Now that it is saved we can always come back to it. Lets also remove the default function in the script in line 6 and replace it with the function we will use in this script we are trying to create, it is called table.new().
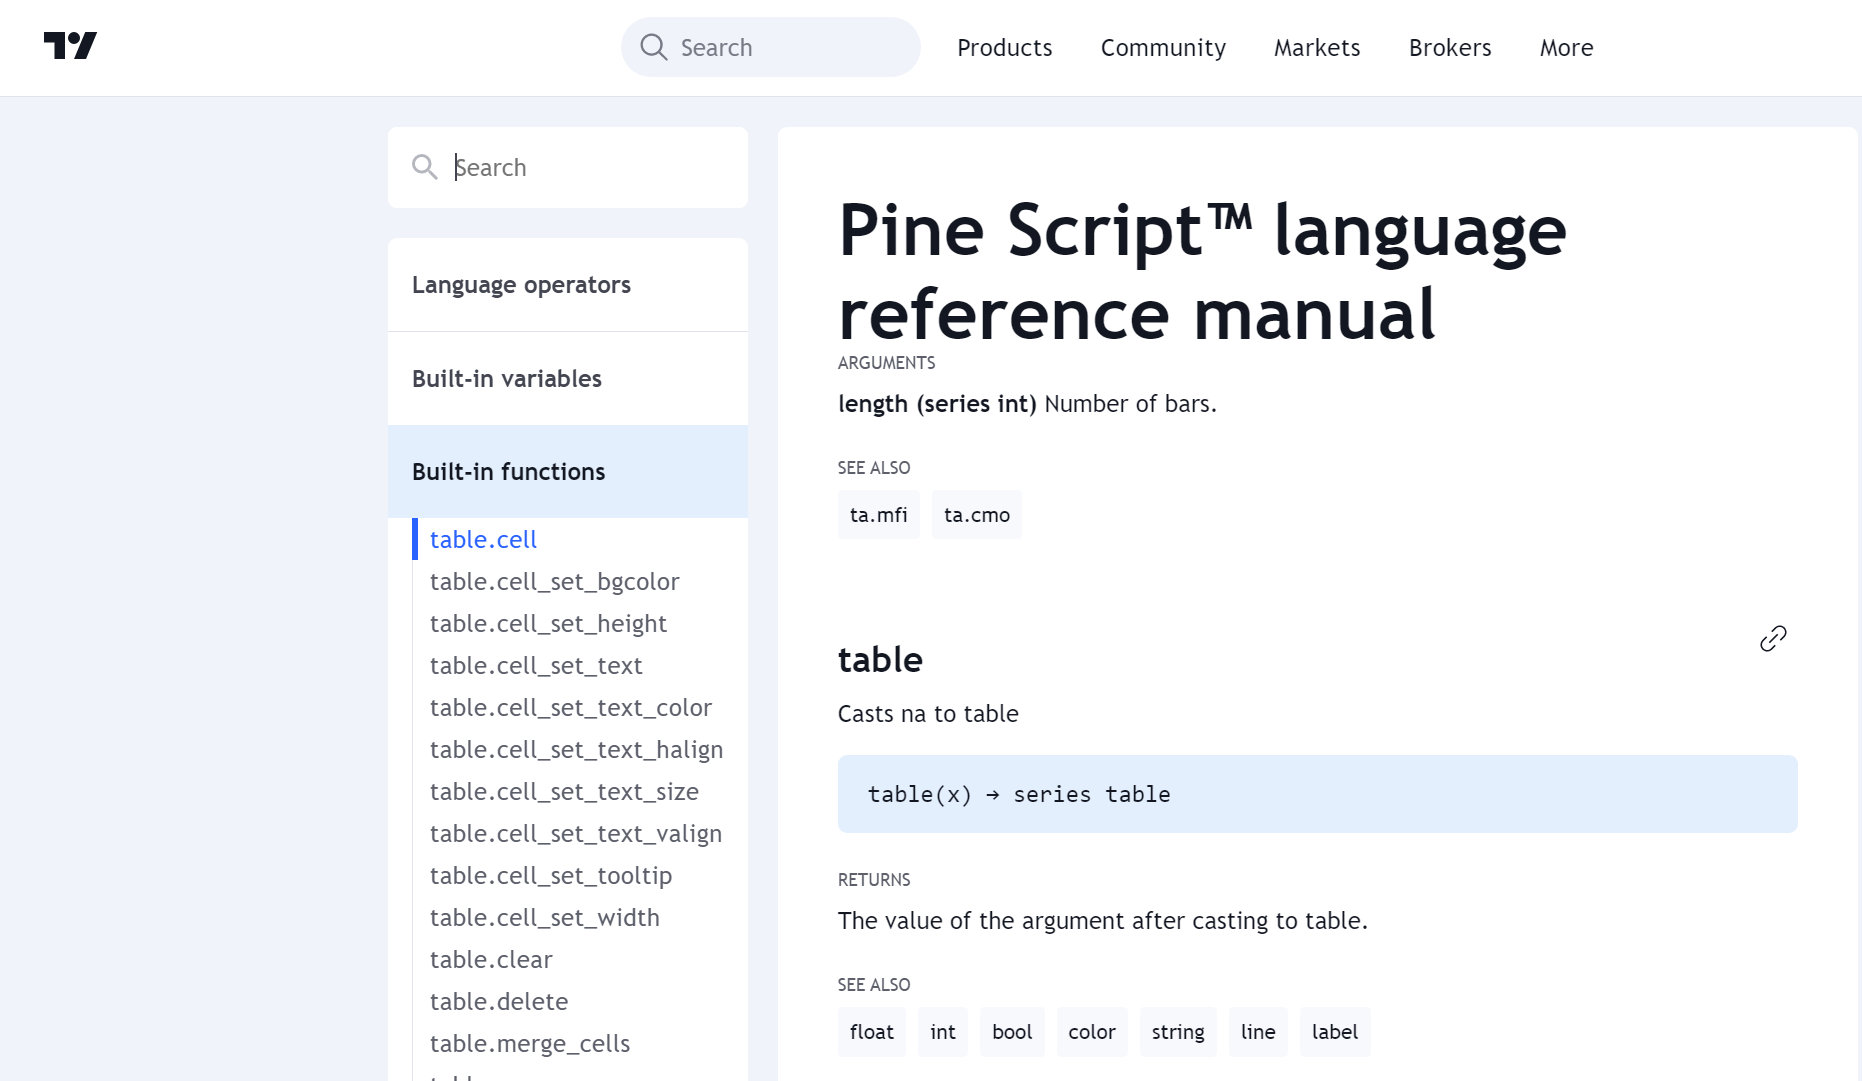
Reference material is here: https://www.tradingview.com/pine-script-reference/v5/#fun_table{dot}new
Your code should now look like this.
//@version=5
indicator("Chart Overlay", overlay = true)
//initialize table element
var overlayTable = table.new(position = position.top_center, columns = 1, rows = 2)
What we’ve done here is created a table called “overlayTable”, using the function table.new(). the arguments passed so far are location and the number of rows and columns – pretty self explanatory. You can pass the text arguments in at this point but I am going to break it out for readability, so bare with me. The next lines of code we will add are shown below – these are mostly taken straight out the Pinescript documentation.
if barstate.islast
    table.cell(table_id = overlayTable, column = 0, row = 0, text = "Enter Title Here", text_color = color.black, text_size = size.large)
    table.cell(table_id = overlayTable, column = 0, row = 1, text = "Enter text here", text_color = color.black, text_size = size.normal)
This what it should look like at this point.
With this code you should not be able to click the “Add to Chart” button (top right of image) – self explanatory – but this will add this as an indicator on your chart.

Your chart should now look like this and you successfully created a chart overlay indicator using Pinescript.

This script is by no means complete but gives a starting point to make this a useful tool.
Key Takeaways
Key takeaway for table.cell() function:
- text = “Enter Text Here” – Change the text in the quotes as you’d like
- text_color = color.black – color.black is a built in function, other colors can be used here color.red etc
- text_size = size.large – size.large is another built in function, other sizes can be used here size.normal etc
In the next pinescript tutorial we will start making variables so that we can modify any and every aspect of the script without changing the Pinescript.
Full code below:
// This source code is subject to the terms of the Mozilla Public License 2.0 at https://mozilla.org/MPL/2.0/

//@version=5
indicator("Chart Overlay", overlay = true)

//initialize table element
var overlayTable = table.new(position = position.top_center, columns = 1, rows = 2)
if barstate.islast
    table.cell(table_id = overlayTable, column = 0, row = 0, text = "Enter Title Here", text_color = color.black, text_size = size.large)
    table.cell(table_id = overlayTable, column = 0, row = 1, text = "Enter text here", text_color = color.black, text_size = size.normal)
Stayed tuned – hope this helped anyone curious about getting started in Pinescript.


